Position Paper · arXiv:2605.11733
LLM inference
should be evaluated as
energy-to-token
production.
API prices for frontier LLMs span an order of magnitude across regions. We argue this gap is not a market artifact — it reveals that inference has become a heavy-industry process whose binding constraint is shifting from peak compute to delivered data-center power. Evaluating accuracy and MFU alone misses the macro-level production question.
Our position
“The ML community must stop treating LLM inference solely as a model or software engineering problem and instead evaluate it through a Token Production Function — token output is bounded jointly by compute-per-token and energy-per-token ceilings under fixed quality and service targets. System optimizations like KV-cache compression, sparse attention, and difficulty-adaptive reasoning are macro-level energy levers, not micro-level engineering tricks.
§ 2 — Framework
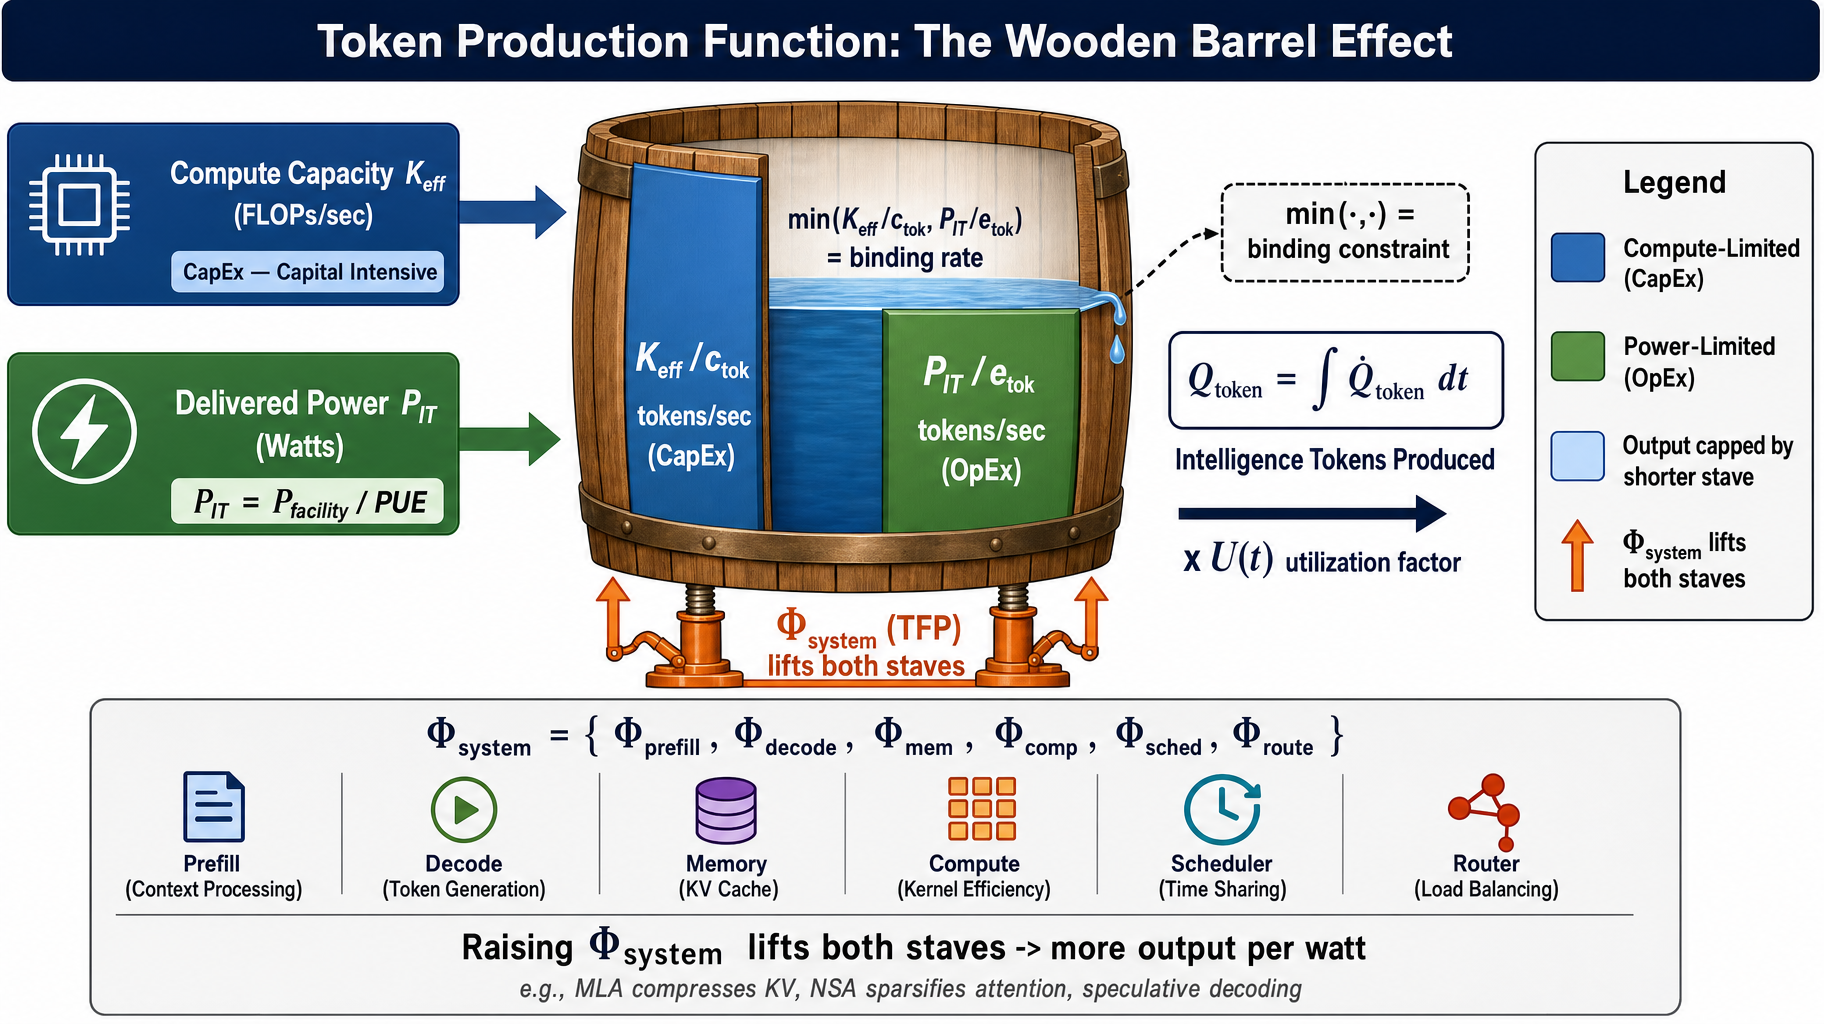
A dimensionally consistent production function.
We borrow Leontief's bottleneck logic from production economics: token output rate is bounded by the shorter of two staves — effective compute and PUE-adjusted delivered power — modulated by a system-level efficiency multiplier Φsystem.
Q̇token(t) = min( Keff(t) / ctok, θ · Pfacility(t) / etok ) × Φsystem(t) × U(t)
Global DC electricity, 2024 → 2030 (IEA)
Φsystem rise since 2020
Listed-price spread
Apr 2026, frontier tier
§ 3 — Empirical lens
Three epochs of inference, viewed through the production function.
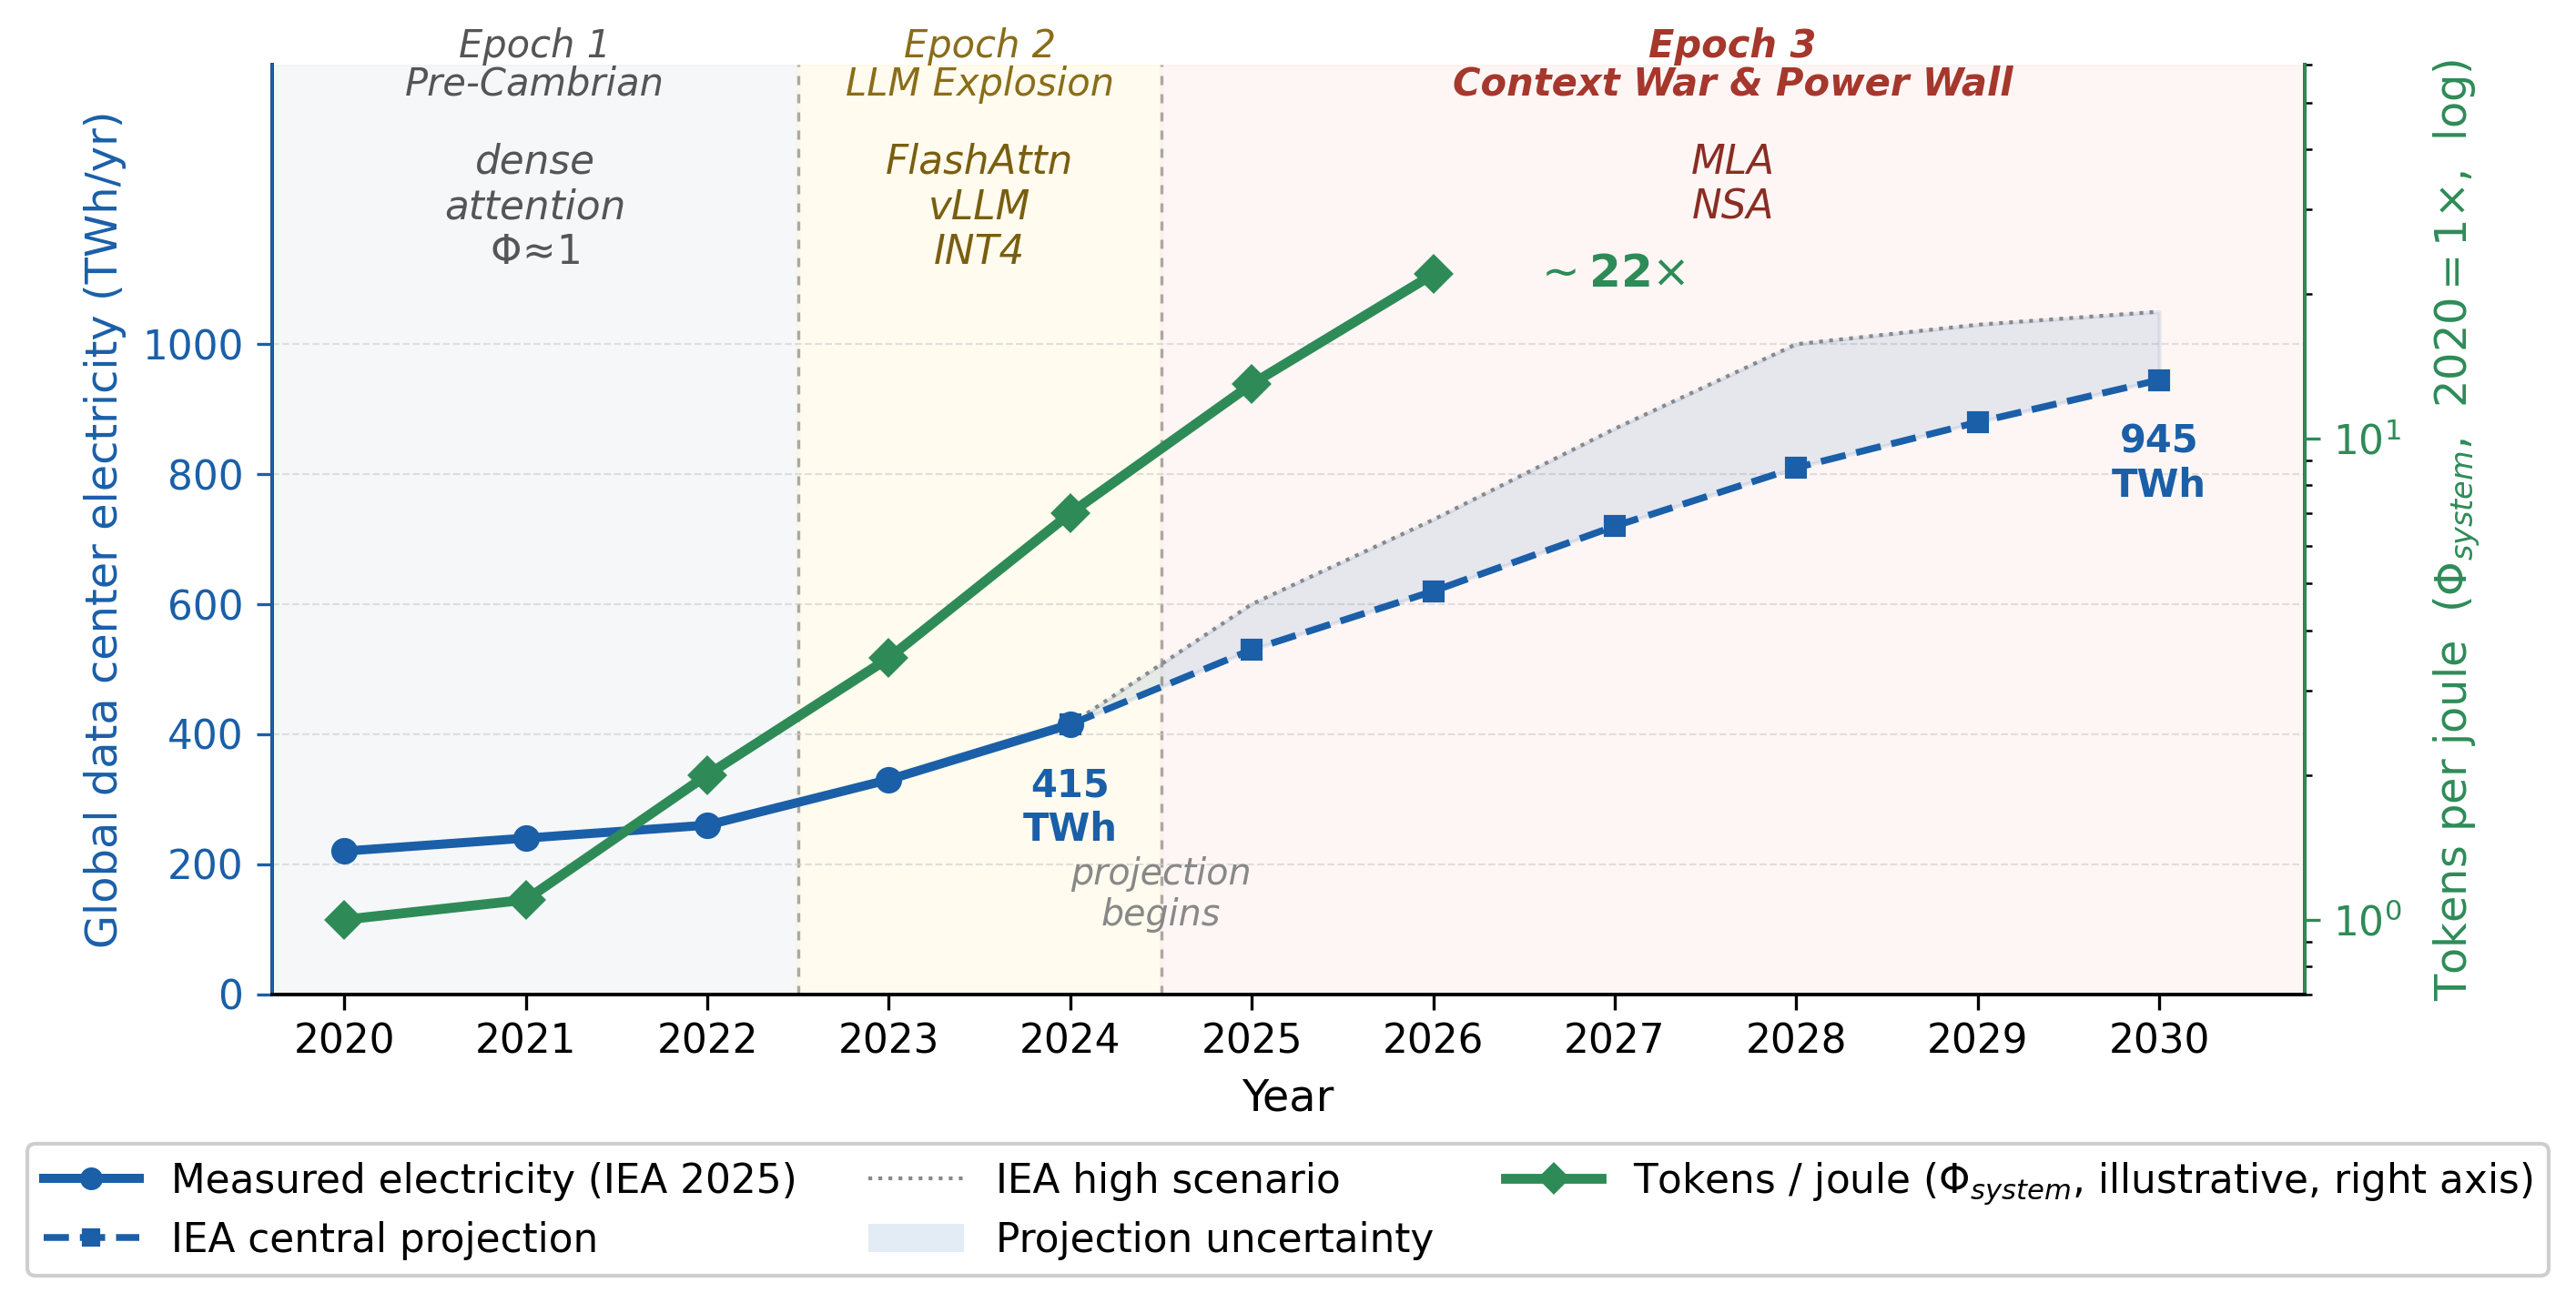
Inference history (2020–2026) maps cleanly onto a constraint-binding story: compute-abundant → compute-explosion → power-bound. Each epoch is defined by which constraint becomes binding and which Φsystem levers ship.
Pre-Cambrian
Both compute and power abundant. GPT-3-scale models on concentrated clusters, dense attention, no KV scheduling.
- Φ ≈ 1 baseline
- Token output negligible vs human data
- Energy hidden in opex budgets
LLM Explosion
Exponential compute growth. First wave of system-level wins makes memory traffic the visible bottleneck.
- FlashAttention · vLLM/PagedAttention
- INT4 / AWQ quantization
- API pricing still relatively uniform
Context War & Power Wall
Context lengths reach 1M+. Some regions hit the delivered-power ceiling first. Price divergence becomes consistent with constraint divergence.
- MLA · NSA · sparse-hybrid stacks
- 415 → 945 TWh global DC electricity
- ~140 T daily tokens in CN, Mar 2026
§ 4 — System optimizations as energy levers
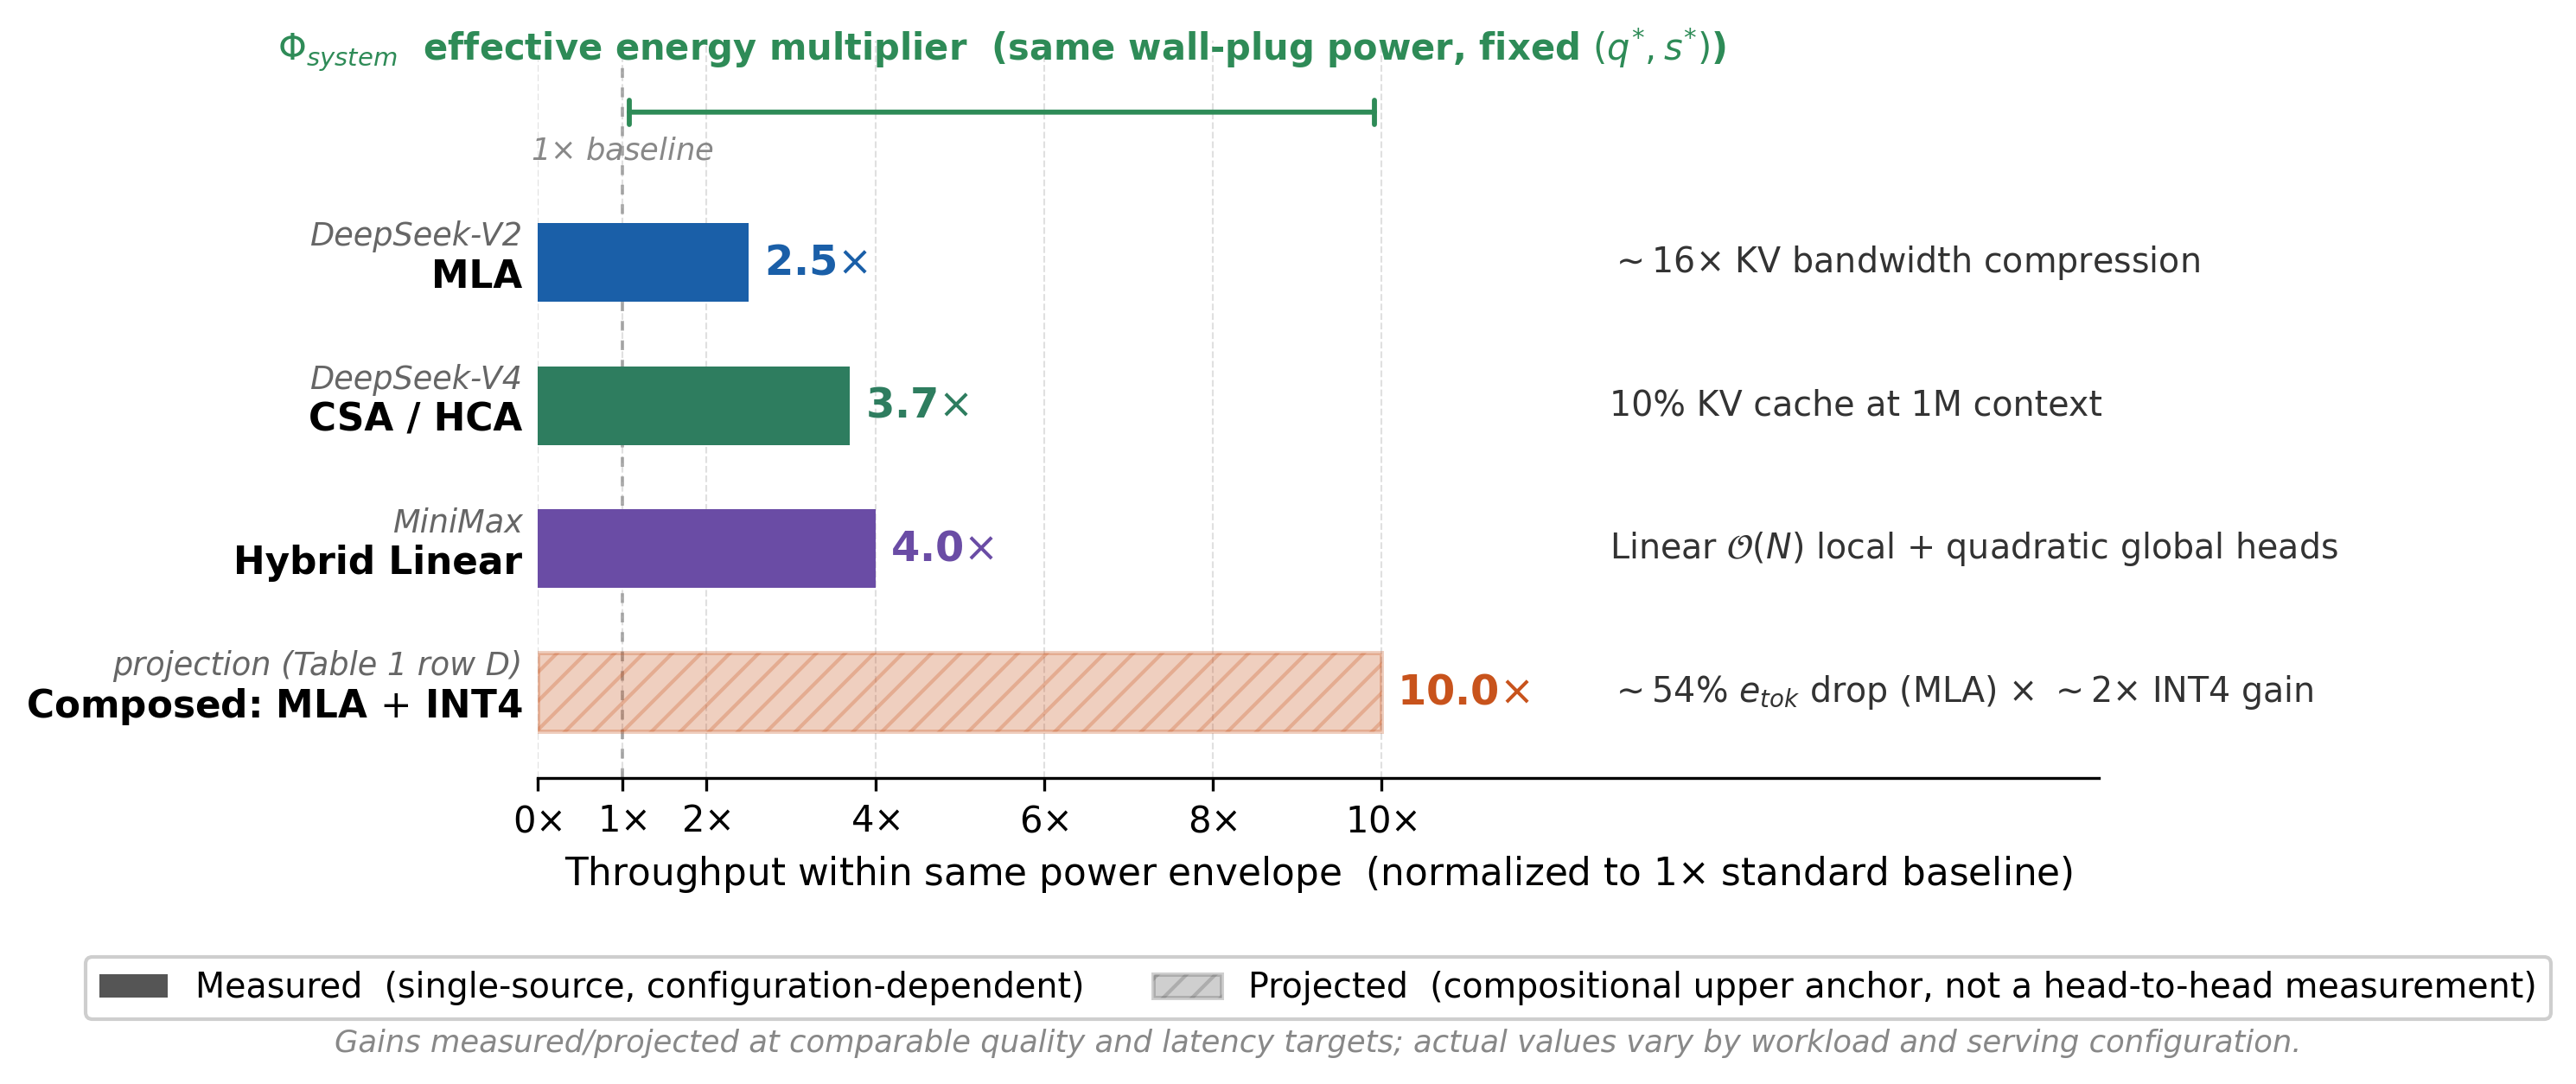
A 50 % KV cache cut is not a benchmark trick. It is a national energy multiplier.
Under fixed quality and SLO targets, MLA, CSA/HCA, NSA, hybrid linear-attention, and difficulty-adaptive reasoning all reduce joules-per-token. Composed, they push the throughput ceiling within a fixed power envelope by an order of magnitude.
§ 5 — Two trajectories
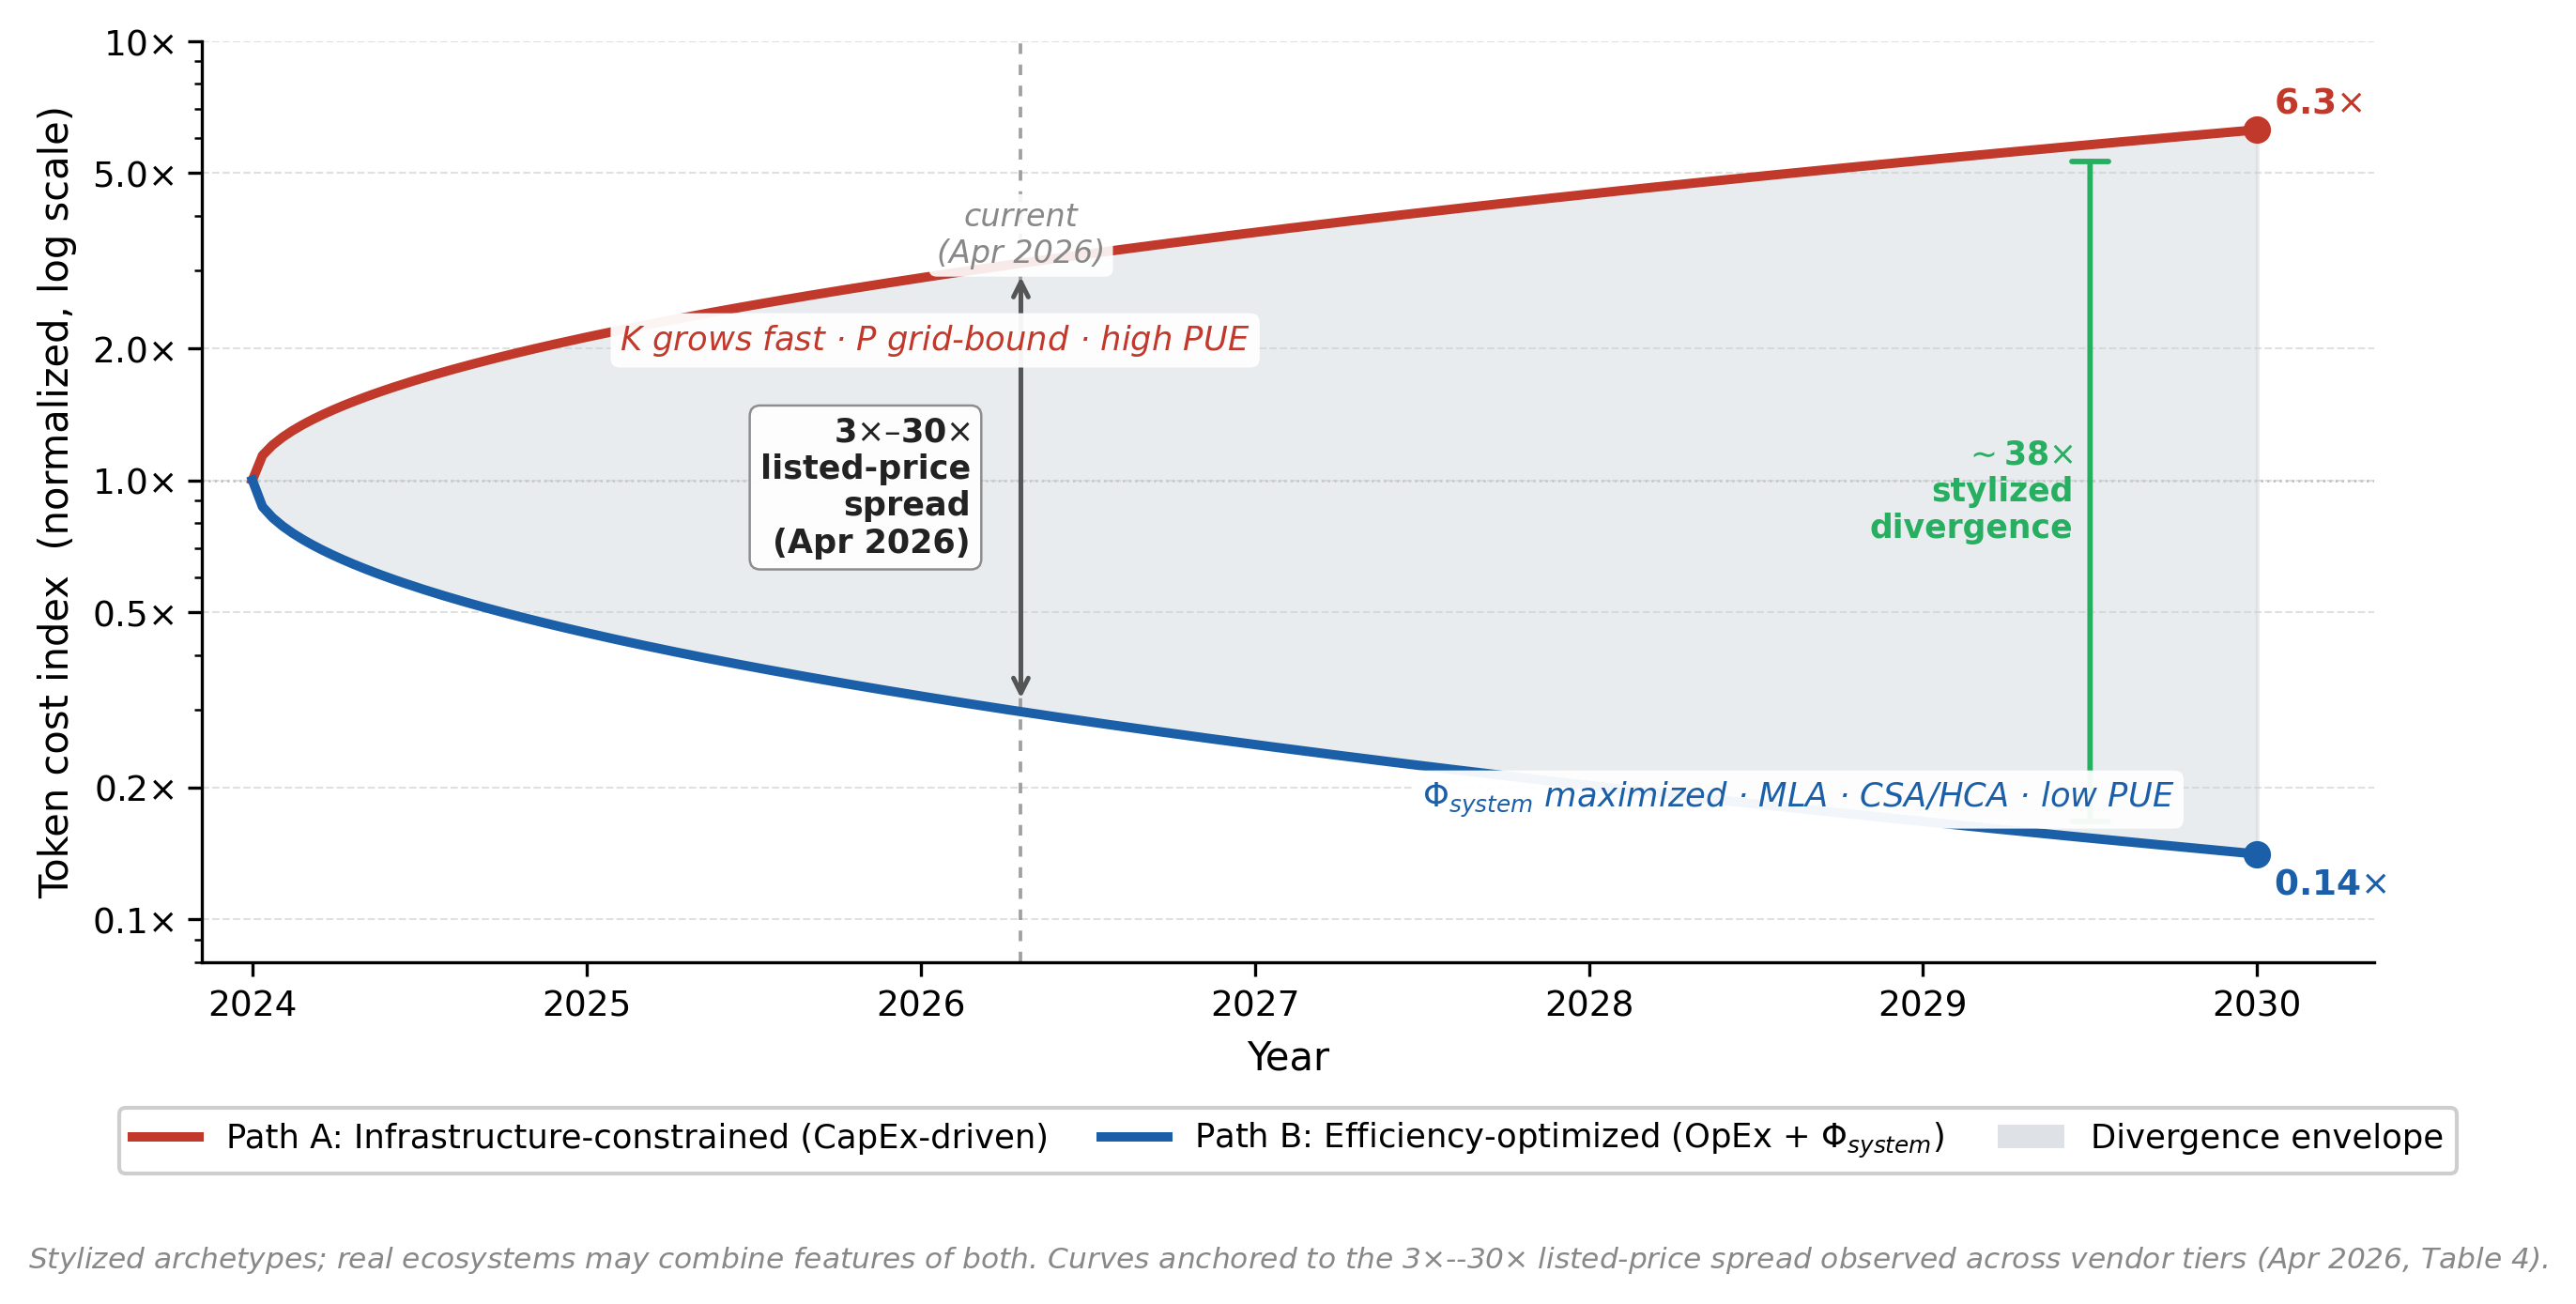
Different binding constraints, different token economies.
Two stylized archetypes — real ecosystems combine features of both. The gap between them is not a market accident; it is a different choice of which barrel stave to lengthen.
Path A · CapEx-driven
The luxury-token trajectory.
Unlimited silicon, constrained grids, high PUE.
- K(t) grows fast, P(t) grid-bound
- PUE 1.5–2.0, legacy infrastructure
- Tokens optimized for peak AGI capability
- Economics shaped by CapEx amortization
Path B · OpEx + Φsystem
The commodity-token trajectory.
Constrained silicon, aggressive infrastructure, low PUE.
- Low PUE 1.1–1.2, modern grid
- Φsystem maximized: MLA · CSA/HCA · NSA
- Ultra-cheap application tokens
- Economics shaped by Joules/token
§ 6 — What we ask of the community
A reporting agenda for inference papers and benchmarks.
Six disclosure dimensions that turn “report Joules/token” from a slogan into a comparable benchmark. Reviewers should treat the absence of these as a reviewable gap, not a stylistic preference.
-
Joules per token at stated (q*, s*).
Quality target (e.g., MMLU-class accuracy) and service target (e.g., 100 ms TTFT) must be fixed before energy is reported.
example 2.3 J/tok @ MMLU 0.71,
≤ 100 ms TTFT -
Active binding constraint.
State whether the deployment is compute-bound or power-bound at the disclosed operating point, with the falsifiable ρ − ρ* diagnostic.
example power-bound,
ρ − ρ* = +0.42 J/PFLOP -
PUE-adjusted delivered power, not theoretical TDP.
Wall-plug power including cooling, networking, and PUE — not GPU TDP under microbenchmarks.
example 580 W wall-plug,
PUE = 1.18 -
Keff convention.
Default to realized effective serving throughput at the disclosed operating point. Peak-throughput Keff may be reported alongside as an upper-bound calibration.
example Keff = 18 % of peak
at b = 64, ctx = 32 K -
Utilization-adjusted token output.
Batching, scheduling losses, and memory stalls must be visible — not absorbed into a single peak number.
example tok/s/GPU at U = 0.7,
scheduler = vLLM 0.6 -
Energy-accounting boundary.
State the boundary: chip · server · rack · facility. Cross-paper comparison is impossible without it.
example boundary = rack-level,
incl. networking, excl. cooling
% Energy-to-token disclosure (cite Liu et al., 2026)
\paragraph{Energy-to-token disclosure.}
We report Joules/token at the operating point
$(q^{*}, s^{*}) = $ ⟨task & quality target⟩, $\le$ ⟨latency SLO⟩ ms TTFT.
Delivered power: ⟨W⟩ wall-plug, PUE = ⟨x⟩,
boundary = ⟨chip|server|rack|facility⟩.
$K_{\text{eff}}$ = realized serving throughput at this point;
peak $K_{\text{eff}}$ reported as upper bound. We classify this
deployment as ⟨compute|power⟩-bound under the $\rho - \rho^{*}$
diagnostic with the configuration above.
Authors · Paper · Citation
The paper.
*Equal contribution †Corresponding author
xliu886@connect.hkust-gz.edu.cn
@misc{liu2026positionllminferenceevaluated,
      title={Position: LLM Inference Should Be Evaluated as Energy-to-Token Production},
      author={Xiang Liu and Shimiao Yuan and Zhenheng Tang and Peijie Dong and Kaiyong Zhao and Qiang Wang and Bo Li and Xiaowen Chu},
      year={2026},
      eprint={2605.11733},
      archivePrefix={arXiv},
      primaryClass={cs.CE},
      url={https://arxiv.org/abs/2605.11733},
}